Soil Acidity Differences in Peanuts

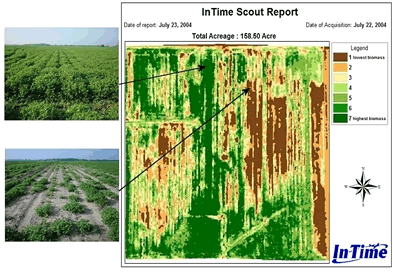
  The seven color image above shows a classified aerial image of a peanut field in South Alabama. It shows seven relative differences in vegetation in the field. The grower knew he had a pH problem in this field, but the image made it painfully clear how big the problem was. The picture on the left top shows peanut plants in Class 7 (dark green areas) where the estimated pH was 6.2. The picture below shows peanut plants in Class 1 (brown areas) where the estimated pH was 4.2. Zink toxicity due to low pH is the most likely reason why the peanut plants died.
       Not knowing if he will have the field next year, he was planning on adding lime to the 'bad' spots in the field in July when those spots are most evident in the crop. However, this image will enable the grower to wait and lime in the late fall or winter when he is certain he will have the field next year.
       In addition, the streaky pattern seen in his peanut crop will not be detected by either gridded soil sampling or zone soil sampling. The variable rate prescription that the grower can write on InTime's website can help to eliminate this pH problem for next year's crop and thus increase profitability.

Download printable version